2 Loading the data
We show the practical use of the tools though a set of simple examples.
2.1 Hello NEX-GDDP-CMIP6
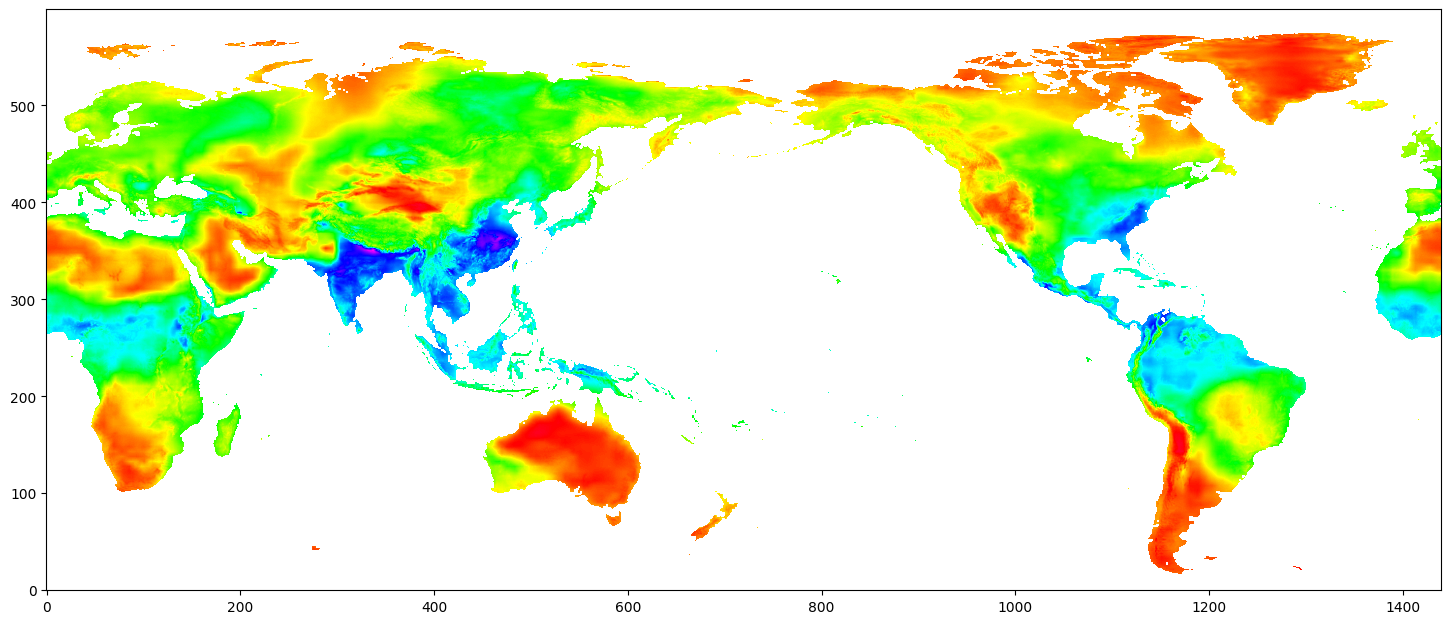
We provide a simple jupyter notebook for loading wiht th OpenVisus library one timestep of one variable and display it though the matplotlib library and also sabing it to a file. In a few lines of Python code a user can plot an image of the NEX-GDDP-CMIP6 as in Figure Figure 2.2.
2.1.1 Notebook Code
| National Science Data Fabric | WIRED Global Center | NASA Open Climate Workbench (OCW) |
|---|---|---|
 |
 |
Access to the CMIP6 data
created by Valerio Pascucci
Import the libraries needed: OpenVisus and numpy
import numpy as np
import OpenVisus as ov
2.1.1.1 Create name of teh datset in variable dataset_name, open it as db and print its information.
# Set climate variables
model     = "ACCESS-CM2"
variable  = "huss"
year      = 2020 # 2015 is the year whne the data switches from historical to simulated
scenario  = "ssp585"
field = f"{variable}_day_{model}_{scenario}_r1i1p1f1_gn"

# Open remote dataset to variable db
db = ov.LoadDataset(f"http://atlantis.sci.utah.edu/mod_visus?dataset=nex-gddp-cmip6&cached=arco")
print("Url:", db.getUrl())
Url: http://atlantis.sci.utah.edu/mod_visus?dataset=nex%2Dgddp%2Dcmip62.1.1.2 Convert the date of desride data into anm index timestep and load the data into a numpy array data to print its information.
# Set timestep to day corresponds to July 21. See https://nsidc.org/data/user-resources/help-center/day-year-doy-calendar
day_of_the_year = 202
timestep =year*365 + day_of_the_year

# load the data into numpy array and print array infomration
data=db.read(field=field,time=timestep) #load anta in a numpy array
np.info(data) # print array information
class: ndarray
shape: (600, 1440)
strides: (5760, 4)
itemsize: 4
aligned: True
contiguous: True
fortran: False
data pointer: 0x7f91bdd65010
byteorder: little
byteswap: False
type: float322.1.2 Plot the data adn save it to an PNG image using the matplotlib library.
import matplotlib.pyplot as plt
my_cmap = 'gist_rainbow'
plt.subplots(figsize=(18,9))
plt.imshow(data, cmap=my_cmap,origin='lower') # matplotlib puts the origin on the top left instead of bottom left
plt.savefig( "NEX-GDDP-CMIP6_ACCESS-CM2_tas_ssp585_2020_day202.png")
plt.show()