import numpy as npimport matplotlib.pyplot as pltimport os,sys# # sys.path.append(r"C:\projects\OpenVisus\build\RelWithDebInfo")import OpenVisus as ovos.environ["VISUS_CACHE"]=os.environ.get("VISUS_CACHE","./visus_cache_can_be_erased")print("VISUS_CACHE is ",os.environ["VISUS_CACHE"])
VISUS_CACHE is ./visus_cache_can_be_erased
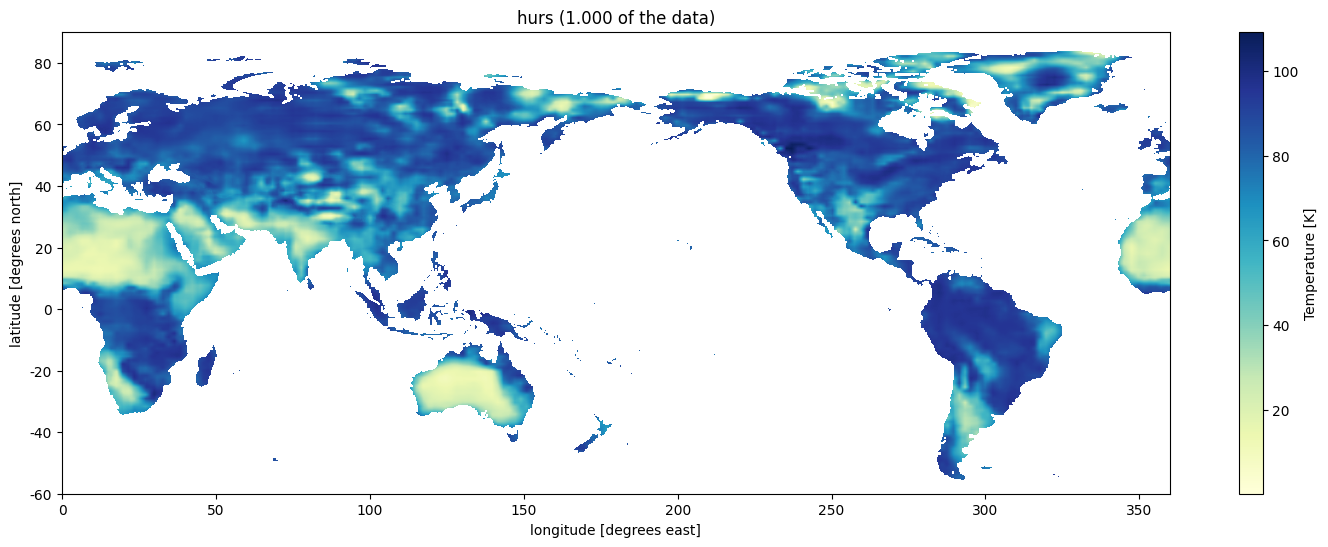
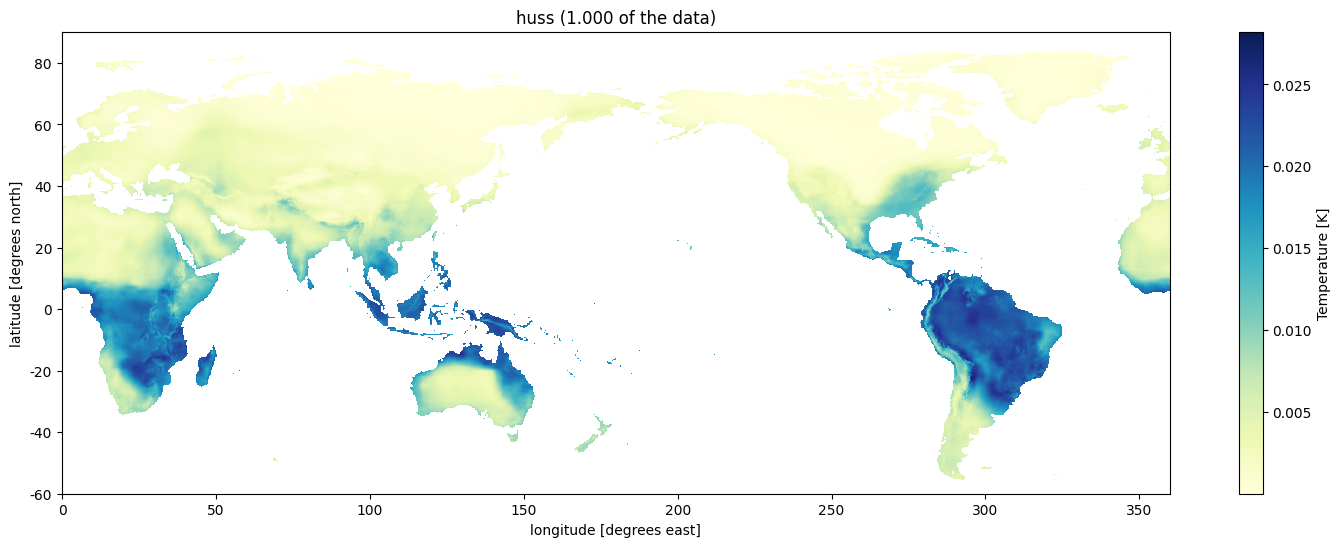
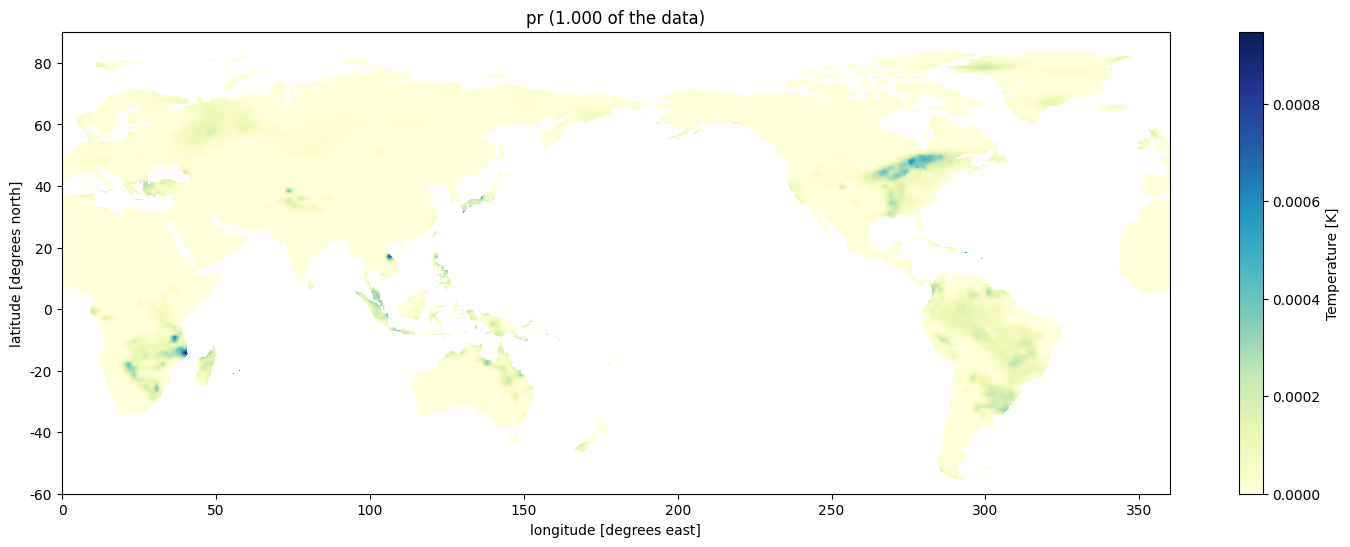
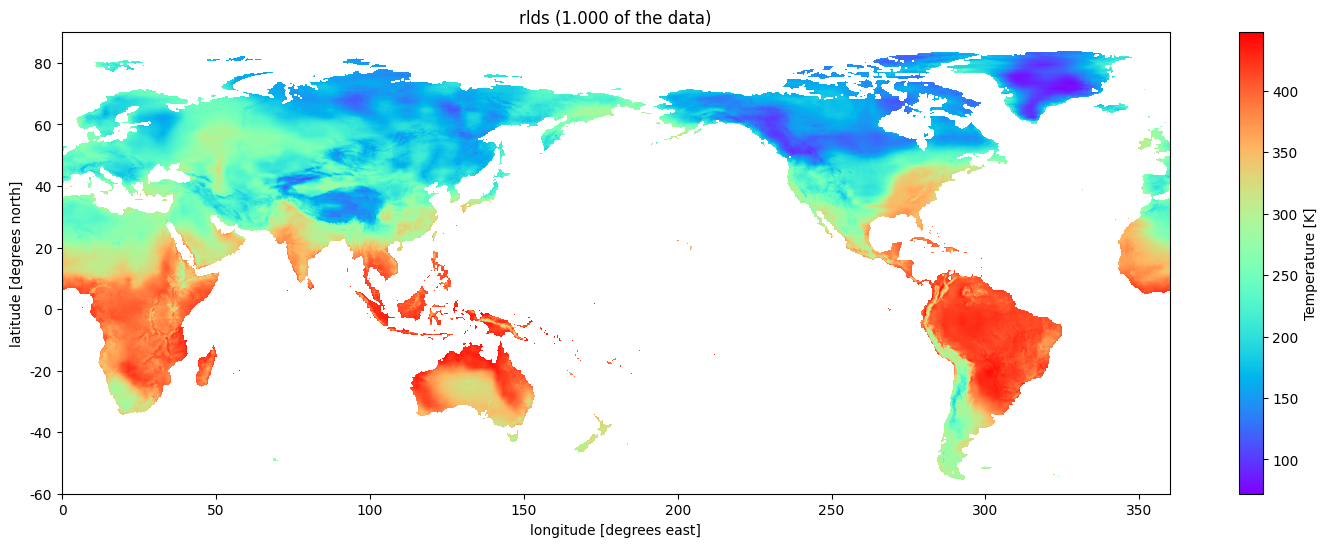
5 More complex examples
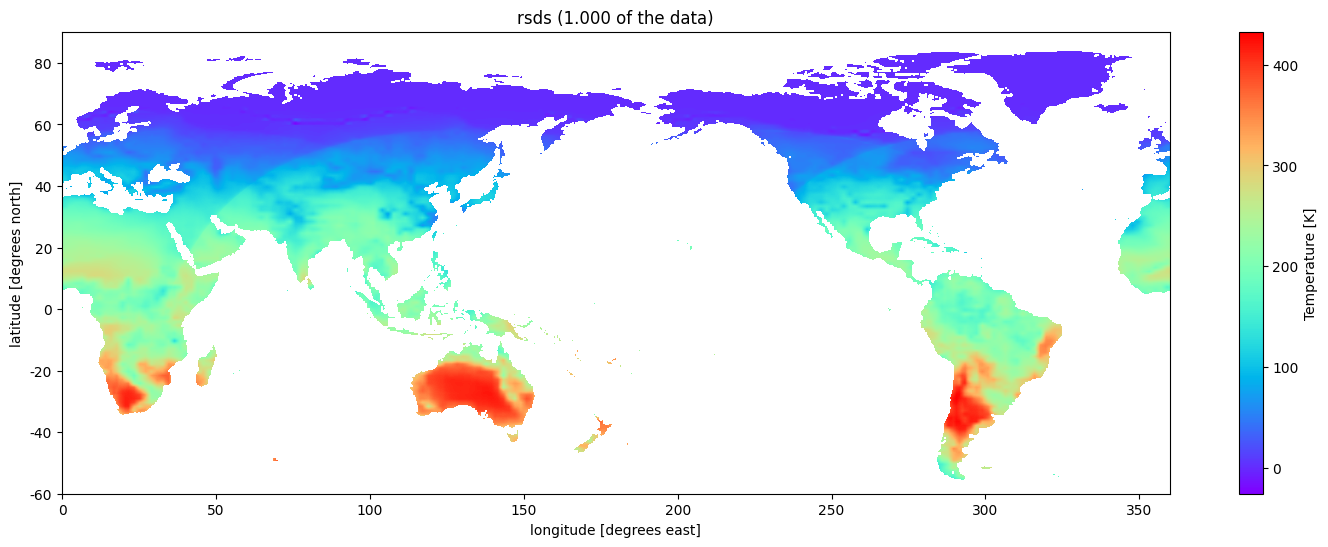
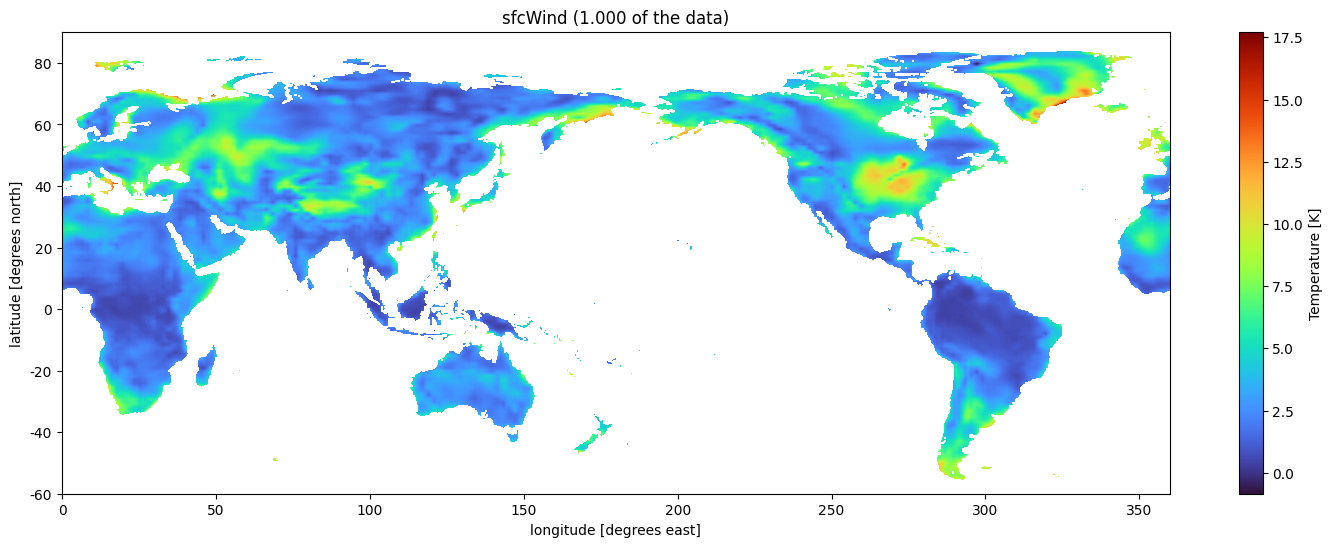
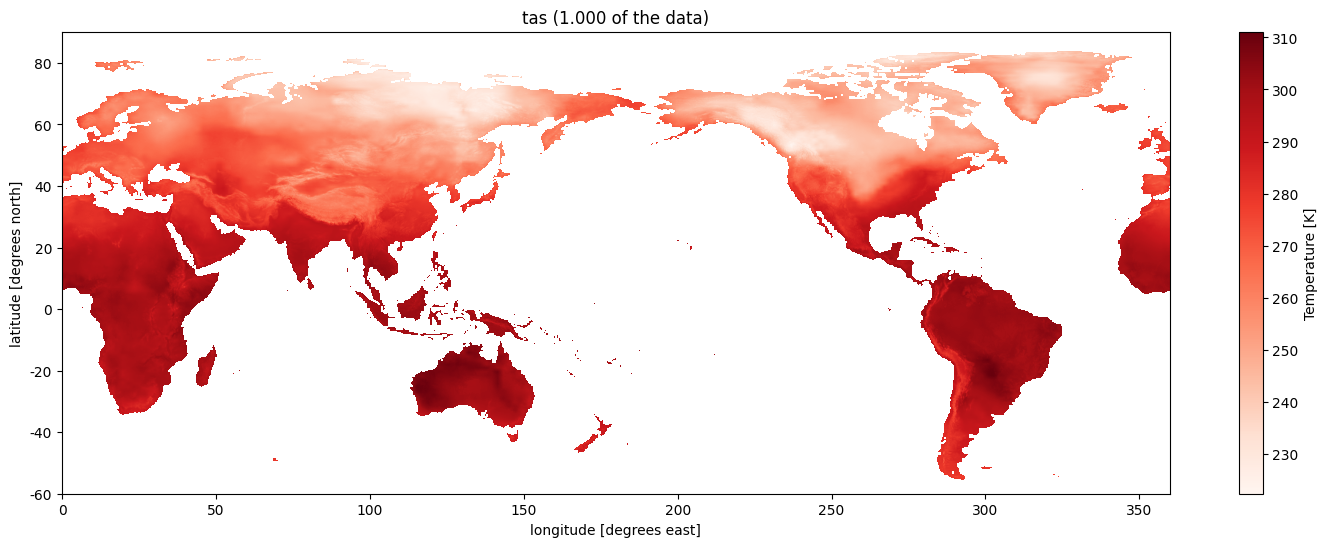
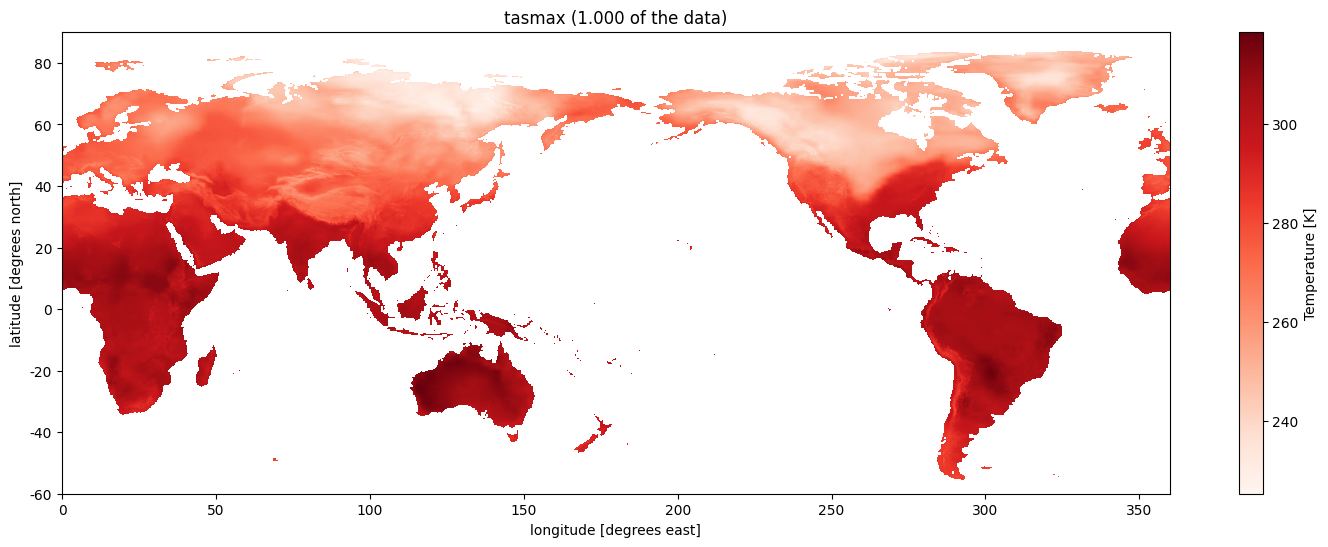
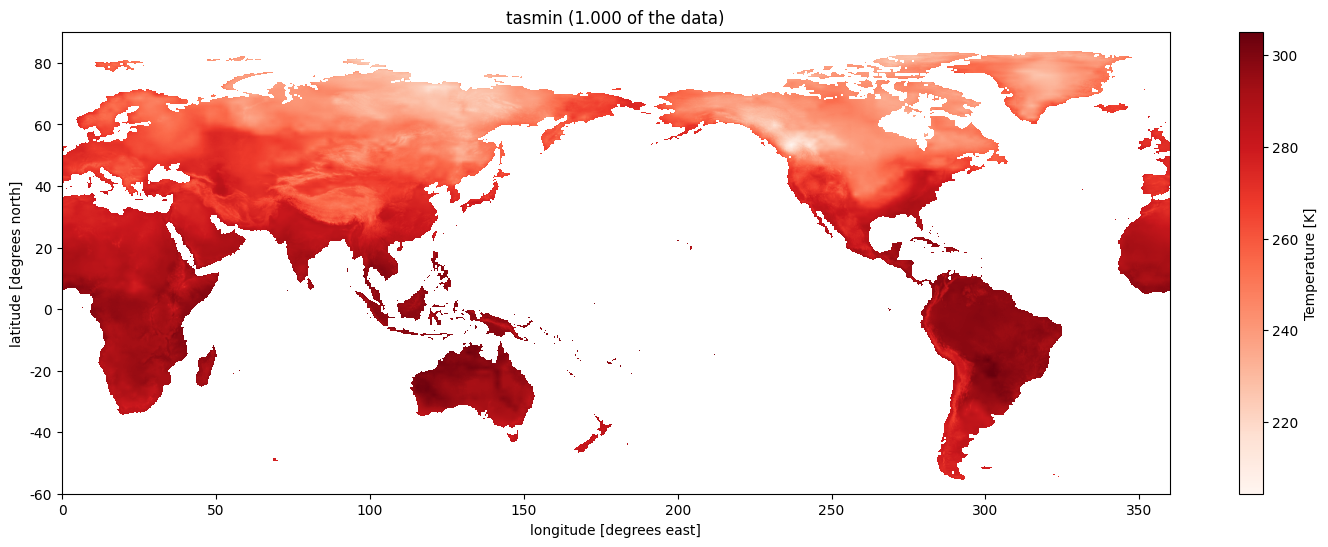
from tqdm.notebook import tqdmvariables = {"hurs": "Near-Surface Relative Humidity","huss": "Near-Surface Specific Humidity","pr": "Precipitation","rlds" : "Surface Downwelling Longwave Radiation","rsds": "Surface Downwelling Shortwave Radiation","sfcWind": "Daily-Mean Near-Surface Wind Speed","tas": "Daily Near-Surface Air Temperature","tasmax": "Daily Maximum Near-Surface Air Temperature","tasmin": "Daily Minimum Near-Surface Air Temperature"}cmpas = ["YlGnBu","YlGnBu","YlGnBu","rainbow","rainbow","turbo","Reds","Reds","Reds"]model ="ACCESS-CM2"year =2015# This is the year whne the data switches from historical to simulatedscenario ="historical"if year<2015else"ssp585"quality =0# Open (connect to) datasetvariable="tas"field =f"{variable}_day_{model}_{scenario}_r1i1p1f1_gn"print(field)db = ov.LoadDataset(f"http://atlantis.sci.utah.edu/mod_visus?dataset=nex-gddp-cmip6&cached=arco")data=db.read(field=field)y_max,x_max = data.shape print(y_max,x_max)xlabels = [str(x) for x inrange(0,360,50)] ylabels = [str(x) for x inrange(-60,90,20)] folder ="./images/"from pathlib import PathPath(folder).mkdir(parents=True, exist_ok=True)for variable, my_cmap in tqdm(zip(variables,cmpas)): field=f"{variable}_day_{model}_{scenario}_r1i1p1f1_gn" my_fig, my_plt = plt.subplots(figsize=(18, 6)) data=db.read(time=year*365+364,quality=quality,field=field) y,x = data.shape xticks = [i*x/x_max for i inrange(0,x_max, 200)] yticks = [i*y/y_max for i inrange(y_max,0,-80)] plot = my_plt.imshow(np.flip(data, 0), cmap=my_cmap) my_plt.set_xticks(xticks, labels=xlabels) my_plt.set_yticks(yticks, labels=ylabels) my_plt.set(xlabel='longitude [degrees east]', ylabel='latitude [degrees north]', title=f"{variable} ({1.0/(2**(-1*quality)):.03f} of the data)")# add a colorbar to our figure, based on the plot we just made above my_fig.colorbar(plot,location='right', label='Temperature [K]') plt.savefig(folder +"NEX-GDDP-CMIP6_ACCESS-CM2_"+variable+"_ssp585_2020_day202.png") plt.show()